![]()
© Crown copyright 2023
This publication is licensed under the terms of the Open Government Licence v3.0 except where otherwise stated. To view this licence, visit nationalarchives.gov.uk/doc/open-government-licence/version/3
Where we have identified any third party copyright information you will need to obtain permission from the copyright holders concerned.
This publication is available at www.infectedbloodinquiry.org.uk
Any enquiries regarding this publication should be sent to us [email protected]
07/23
Towards the end of the hearing regarding the Statistical Expert Report to the Infected Blood Inquiry on 9 November 2022, two questions were raised. Firstly, Ms Richards KC invited us to make recommendations about how data collection could be improved,[1] and secondly, Sir Brian Langstaff asked for our advice on overall mortality attributable to contaminated blood and blood products.[2] This document represents the response of the group to those two questions.
It is worth restating what was said in the Introduction to the Statistical Expert Group’s (SEG’s) original Report:
“It is important to be clear about the limitations of what we can conclude from this, and indeed any other, statistical investigation. In brief, any conclusions we draw from data will depend on:
Availability: sometimes the information we want was not collected or not retained.
Definitions: the numbers depend crucially on the criteria in use at the time, for example, what is meant by an antibody-positive HCV test has varied considerably over time.
Quality: data may not be accurate, particularly when part of routine collections rather than a planned study.
Completeness: data may be missing for a variety of reasons – and sometimes the fact that data are missing may itself be informative.
Context: for example, we need to take into account why the data were collected (for example, by review of death certificates; or at autopsy), and what was known at the time.
Skill in Interpretation: statistics are sometimes represented as hard ‘facts’, but the caveats listed above should make it clear that they can be much ‘softer’ than perhaps perceived. Drawing conclusions from data is not some automatic process, and judgement is always required – the data do not speak for themselves.
As explained previously, we try to be clear about these concerns by not only reporting numerical ranges expressing uncertainty about quantities, but also judgements on our confidence that the available data can answer the primary questions of interest.
An important limitation is that statistics are always an imperfect representation of what we are actually interested in. Tables and graphs of numbers of people infected and their subsequent survival are inevitably a gross, even harsh, summary of the suffering endured by those individuals and the people close to them. We provide no measures of illness, psychological distress, financial harms, family stress, and the many other ways in which infected blood will have damaged lives. In particular, we do not attempt to estimate onward-transmission to partners, children or others. We hope that readers will recognise our understanding that, beneath all the counts and measurements, there are individual human lives. But it is only by summarising all those experiences into bald numbers that we can properly assess the magnitude of what has happened.”
The second question asked – the overall mortality attributable to contaminated blood and blood products – is particularly challenging to answer for the reasons outlined above. The true cause of death may be uncertain. For a death to be attributable to infected blood, it has both to be recognised as such and be described clearly. Overall, there are limited data of uncertain quality, with no clear classification indicating death due to infected blood and so care is required in interpretation. In addition, a significant proportion of the total number of deaths (deaths due to HCV infections from blood transfusions) comes from statistical modelling rather than counting cases of interest from databases. This adds uncertainty due to the assumptions necessary in the models.
We hope it is clear from what we said at the hearing, we are fully aware that we are not simply manipulating numbers. We are dealing with tragic events, and while we try to be as careful as we can, there will still be substantial uncertainty in the numbers presented. It is important to acknowledge the considerable uncertainty around the central estimates, due to the unavoidable limitations in our knowledge.
Sheila Bird, Stephen Evans and David Spiegelhalter on behalf of the Statistics Expert Group (SEG).
On 9 November 2022 towards the end of the Statistics Expert Group panel hearing, Ms Richards KC invited us (members of the Statistics Expert Group) to make recommendations “about how data collection could be improved”.
All nine UK-affiliated group members (authors of the Expert Report to the Infected Blood Inquiry: Statistics) recorded their priorities independently. Each of the 12 recommendations had high or medium support by two-thirds of the nine appraisers. Seven recommendations (asterisked) were rated high by six or more respondents.
The cost and likely cost-effectiveness of our recommendations are for others to appraise, although in practice it is challenging to assess the benefits of precautionary measures, including better information.
No international comparisons are made other than to remark that record-linkage across health, social care, education and prison registers is greatly facilitated in countries such as Sweden and Denmark which assign a personal number at birth.
All nine UK-affiliated group members (authors of the Expert Report to the Infected Blood Inquiry: Statistics) recorded their priorities independently. Each of 12 recommendations was supported (high or medium) by two-thirds of the nine appraisers. Recommendations are summarized in the resulting priority order. Appraisers did not take the cost of implementation or cost-effectiveness into consideration.
| TWELVE RECOMMENDATIONSin assigned priority order | Assigned priorities | |||
|---|---|---|---|---|
| High | Med | H+MSUM | Low | |
| Alerts | ||||
| Persons with a bleeding disorder who were first treated in UK before 1992: to be alerted to ask to be Hepatitis C Virus (HCV) antibody tested if unsure about their HCV-status | 9* | 9 | 0 | |
| Three surviving subgroups who were transfused in UK before 1 September 1991 (defined by age-band at 31 December 2014): to be alerted to request an HCV antibody test if unsure about their HCV-status | 8* | 1 | 9 | 0 |
| Linkage of a patient’s transfusion usage and blood product usage to the patient’s general practice electronic health record | 6* | 3 | 9 | 0 |
| Transfusion Medicine | ||||
| Historical prevalence assessed via stored donor serum bank | 6.5* | 2.5 | 9 | 0 |
| 5-yearly transfusion-cohorts followed by record-linkage | 6* | 2 | 8 | 1 |
| In event of a new transfusion-transmitted infection which may transmit sexually and/or mother-to-child, early consideration to be given to testing and assessing the impact on partners, children & parents | 5 | 3 | 8 | 1 |
| National Haemophilia Database of the UK Haemophilia Centre Doctors’ Organisation (UKHCDO) | ||||
| Rigorous, adequately funded and statistician-supported National Haemophilia Database for persons with a bleeding disorder: as for those who receive donated organs | 6.5* | 2.5 | 9 | 0 |
| National Services: such as UK Health Security Agency (UKHSA), national Blood Services, UKHCDO | ||||
| Those who are newly diagnosed with new blood-borne infection to be asked about receipt or donation of blood/tissue: using nationally agreed questions | 6* | 2 | 8 | 1 |
| Enable better cross-referencing between databases, for example via no-names master-index, Community Health Index or National Health Service number | 4 | 4 | 8 | 1 |
| The history of epidemics should not be overlooked by reporting on the past 10-years only | 4 | 3 | 7 | 2 |
| Additional evidence of potential use to Funds | ||||
| Best-science typically requires access to a relevant post-exposure blood/tissue sample | 2.5 | 4 | 6.5 | 2.5 |
| Database(s) on funded-claimant-cohorts should be properly managed, such as to scientific standards, and analysable | 2 | 4 | 6 | 3 |
Seven of the 12 recommendations were rated high by 6 or more respondents, as follows: all three recommendations on Alerts; two of three recommendations on Transfusion Medicine; together with recommendations on: those newly diagnosed with a blood-borne infection being asked about receipt or donation of blood/tissue; and on the need for rigorous, adequately-funded and statistician-supported National Haemophilia Database for persons with a bleeding disorder (PwBDs) as for those who receive donated organs.
If any such patients are not completely sure about having already tested HCV antibody negative, please ask your GP for an HCV antibody test so that there is no doubt. [NB Salivary HCV testing is less sensitive but is an option which avoids needle-stick should the patient so wish.]
Comparison between the age-sex bands for England’s claimants (registered with financial assistance schemes) who were HCV-infected by transfusion and alive at 31 December 2014 with the Statistics Expert Group’s (SEG) estimated chronically HCV infected survivors for England identified three sub-groups who may benefit from being alerted:
2.1 Males and females who were aged 30-39 years at 31 December 2014 [and so born 1975 to 1984] who had received transfusion(s) during 1975 to August 1991 – essentially as a child: Median stochastic estimates for England are that male chronically HCV infected survivors outnumber females by 220: 120 (total of 340). Haematological cancers and chromosomal abnormalities may be dominant reasons for their having received transfusions in childhood. Claimants are at best one-quarter of those expected by stochastic simulation.
2.2 Males and females who were aged 40-49 years at 31 December 2014 [and so born 1965 to 1974] who had received transfusion(s) during 1970 to August 1991 – essentially as a child or young adult (up to 26 years of age): Median estimates are that male and female chronically HCV infected survivors are similar in number (total of 370) but that only one-third feature as a claimant. The reasons for transfusion may be different between the sexes as female survivors may have received transfusion in association with pregnancy.
2.3 Pregnancy will be a predominant reason for female survivors who were aged 50-69 years at December 2014 [and so born 1945 to 1964] to have received HCV-infectious transfusion(s) during 1970 to August 1991: Just over half (54%) of 860 such females, as estimated by stochastic simulation, feature as claimants.
Currently, donor blood samples and pre-transfusion recipient samples are stored for a short period post-transfusion to facilitate the investigation of short-term transfusion-related hazards only.
Representative, long-term storage of residual samples per donation did not occur during 1970-1991 so that when a new blood-borne virus was identified (HIV; HCV) and an antibody test was subsequently developed by which to protect the blood supply, the historical prevalence among blood donors of a virus such as HCV with a long incubation period to clinical disease could not be determined empirically.
There is no guarantee against the UK’s blood supply being threatened again by a novel blood-borne virus which, like HCV, has a long incubation period to clinical disease.
But a well-designed system for long-term storage of representative residual samples per donation would allow the historical prevalence of a new virus to be determined efficiently.
[Possible methodology: Select four weeks at random each year (say, one week chosen at random per 13-weeks per calendar-year) with all residual samples to be stored from each blood donation in the randomly sampled weeks.
Each residual sample would have associated with it a brief demography about the donor (age in completed years at donation, sex, NHS region, country of birth as UK versus non-UK).
Such a serum-bank, of representative residual samples per donation, would - in the future - enable the UK to monitor the historical prevalence in blood donors of any new virus which is discovered to be transmissible in blood and is testable-for in the stored no-names samples.]
Such cohorts enable two objectives:
5.1 To monitor the use of transfusion (for example, for whom - by age, sex, hospital where transfusion occurred, number of red blood cell units transfused, whether any other type of unit was also transfused and ICD10 discharge-code for the hospital-attendance when the index transfusion was administered).
5.2 To compare, between 5-yearly cohorts, the influence of demography, transfused units and underlying disease on patients’ survival in distinct epochs of follow-up (such as 1st 4-weeks, rest of 1st year, rest of 1st 5-years, 2nd 5-years, 2nd decade).
On-study and follow-up forms (or data-screens) need to be designed to RCT-standards to ensure a high standard of completion with record-linkage to establish survival-status as a back-up, for example for patients who have been lost to follow-up.
Since patients with bleeding disorders may, in future as in the past, be vulnerable to new transfusion-transmitted infections (new-TTI), there needs to be better cross-referencing between patients registered with UKHSA/PHS as having been diagnosed with new-TTI and donors or patients known to national Blood Services or UKHCDO as potentially at-risk. The detailed work of National vCJD Surveillance Unit in establishing whether a patient diagnosed as definite or probable vCJD had ever received (from whom) or donated blood/tissue (to whom) and the alerting of these vCJD-implicated persons illustrates what can be achieved - albeit for fewer than 200 vCJD cases.
Master-index was defined as initial of first name, sounder of surname (e.g. B630 for Bird, Bard, Bert), sex, date of birth. Scotland’s record-linkage is facilitated by its Community Health Index (CHI) numbers which, unlike NHS numbers, have a check-digit as a summation-guard against mis-typing.
When a series of claims is dismissed on the same presumptive grounds of “no known infectivity” (for example, women with no other risk factors who were HCV-infected – they believed – by administration of infected anti-D intramuscular immunoglobulin in UK), the number of such dismissed claims may rise to an extent that warrants re-analysis – using best science - of the grounds for dismissal.
11.1 Claimants and their doctor should be advised to locate (if possible) a residual stored blood sample taken soon after the claimant’s exposure; or for the claimant to provide (for storage) a blood sample at the time of submitting their claim.
When a series of claims is dismissed on the same presumptive grounds, best science may include phylogenetics (ideally on a blood sample taken soon after transfusion) to establish historical clustering. However, once claimants have been diagnosed as chronically HCV infected and have received directly acting antiviral treatment to achieve sustained virological response, the potential of phylogenetics to identify historical clustering is gravely undermined. Hence, now and in the future, there is a need for for claimants to register an early relevant blood sample.
11.2 Persons with bleeding disorders who have been advised that they have been exposed to vCJD-implicated blood or blood products should, in life, consider giving consent for autopsy in the event of their death to establish if there is evidence of abnormal prion protein in lymphoid tissue.
Chapter 6 of the SEG Report records that some post-mortems were carried out, one on the instruction of HM Coroner but such an instruction is not inevitable, as Chapter 6 also records. Post-mortem testing for the presence of the abnormal prion protein in lymphoid tissue is not only a means to establish the basis for an exposure-claim but also the only way in which evidence can be accumulated to revise the risk-assessment that those who survive have to live with to protect others.
For effective surveillance of transmissible blood-borne diseases, “data collection” should ideally be interpreted to include the collection of a suitable biological sample by which to determine infection-status. For example, as chairman of the Medical Research Council’s Committee on Epidemiological Studies on AIDS, Professor Nick Day, determined that no study of risk behaviours for Human Immunodeficiency Virus (HIV) would be funded by the committee unless the proposed data collection included a biological sample that could be tested for HIV antibodies so that no-names linkage could be made between individuals’ risk-factor questionnaire and HIV-status.
We acknowledged that, in the late 20th century and thereafter, look-back was done well from patients who had died from variant Creutzfeldt Jakob Disease (vCJD) to establish their donation history and hence trace recipients of vCJD-at-risk donations; and also to alert as potentially vCJD-at-risk persons who had donated blood or tissue to a patient who subsequently developed vCJD. However, a low proportion (under 20%) of the persons thus alerted who subsequently died without having developed vCJD were subject to post-mortem to establish if abnormal prion protein (PrPSC) was present in their lymphoid tissue.
We also remarked that any database needs to be properly managed and analysable; and that it is not a trivial matter to get these things right. Particularly challenging is the proper management of data collected on a cohort of infected or at-risk persons when analysis of their survivorship from the date of infection is the goal. In general, date of infection is not known exactly and at-risk persons in the analysis cohort switch to “known to be infected” at their test-date, symptom-onset-date or death-date (if their infection-status was determined at or around the time of death, including by autopsy). In short, the data collected should include the date when infection was diagnosed. Moreover, if patients join an analysis-cohort only after infection was diagnosed, then their survivorship from infection to the diagnosis-date is a given (else the diagnosis would not have been made), and so – unless handled correctly at analysis – serious ascertainment bias can arise.
Finally, the Expert Report to the Infected Blood Inquiry: Statistics includes several examples of databases that were compiled under different auspices (disease surveillance, at-risk-exposure cohort, financial support for infected persons) but which related to some of the same patients. Added-value in terms of quantifying how many persons meet description X (for example: injector of heroin in the past year) can be gleaned from cross-referencing between databases A (drug misuse register), B (admissions to accident and emergency) and C (HCV register) to establish how many persons meeting description X feature in all three databases (ABC), how many in two of the three (AB, AC, BC) and how many on just one of the three. By making suitable assumptions, we can then estimate, for example, how many heroin injectors in the past year were missed by all three databases.
Individually unconsented, no-names record-linkage across databases requires that a strong case for public benefit has been made and that strong protection against deductive disclosure of individual identities is assured, see Goldacre Review (https://www.goldacrereview.org/) for a recent account of “trusted research environments”. Many permitted record-linkages – particularly to death-records, which are least contentious - have led to major discoveries about the public health. Discoveries range from the 1990s’ substantially higher risk of drugs-related death (~ 7 times higher) in the first fortnight following release from prison than at comparable other times at liberty to elegant record-linkage work during COVID-19 to estimate vaccine-effectiveness against different variants.
| Group | Combined estimates by selecting proportional to aggregate scores | 95% uncertainty interval | (SEG Report) | |
|---|---|---|---|---|
| (a) | HCV infections in transfusion recipients | 1,640 | 550 to 3,440 | 1,820 (95% uncertainty 650-3,320) |
| (b) | HIV infections in people with bleeding disorders | 820 | 730 to 910 | around half (625) |
| (c) | HCV infections in people with bleeding disorders | 350 | 255 to 590 | no estimate (UKHCDO 248) |
| (d) | HIV infections in transfusion recipients | 35 | 32 to 40 | no estimate(85% died, cause unknown) |
| (e) | Diagnosed vCJD or carriage of abnormal prion protein in recipients of vCJD-implicated blood transfusion or blood products | 5 | 3 to 8 | 3 |
| Total | 2,900 | 1,750 to 4,650 |
Hazard ratios are used to summarise results of analysis of death rates. They can be used for other events than death, for example, progression rates, but the principles are the same.
When analysing death rates, we take account of how long people survive from a start-time, which is usually the time when follow-up began (for example their diagnosis date or recruitment date into a study or cohort of infected persons) when they are alive; and they are followed over time until they die.
Typically, we are interested in how death-rates vary over the course of follow-up. In particular, we may wish to compare death-rates in the first year of follow-up versus for those who have already survived for at least 5 years in the cohort.
To estimate the death-rate in the first year of follow-up, we count the number of people who die in that period, divided by the number of people who started their follow-up, each of whom contributes either a full-year (if they survived to the start of their 2nd year of follow-up) or a part-year (if they died with in the 1st year or withdrew from the study for other reasons - such as emigration - during their 1st year of follow-up). This is a death rate per unit of time, also called a hazard rate.
A hazard ratio is the ratio of the hazard rate in two groups. One group is used as a reference (control or comparison group), sometimes an untreated group or people without a particular diagnosis and their hazard rate is used in the denominator of the ratio. The other group, one with that diagnosis, is then compared with the reference.
If, in the reference group, 100 deaths occur out of 10,000 persons followed for a year, then the death rate is 100 per 10,000 (or per 9,950 if deaths are assumed to have occurred half-way through the year). In the group with the diagnosis, suppose that 153 deaths occur, also out of 10,000 followed, then the ratio of these death rates, the hazard ratio (HR) is 153/100=1.53.
A value of 1.0 for the HR indicates that the death rates in the two groups are the same. An HR greater than 1 suggests that the group of interest (with a diagnosis for example) has a higher death rate than the reference or control group. An HR of less than 1 suggests that the group of interest (with a diagnosis, for example) has a lower death-rate than the reference or control group.
From the example above, it can be seen that an HR of 1.53 can also be said to be a 53% increase in death rate.
While this can seem like an unnecessary complication when one could just give the death rates in the two groups, the hazard ratio is extremely useful in summarising more complex statistical analysis of death rates, or survival times, when adjustment has to be made for other explanatory factors (such as a bleeding disorder, co-infection, sex and age-group).
Adjusted hazard ratios can be used to estimate the number of deaths attributable to the risk factor of interest, in this case a diagnosed blood-borne infection. For example, if a diagnosis of chronic HCV infection is estimated to produce a hazard ratio of 1.53, and there are 100 deaths expected from other causes in those without a diagnosis, we would expect 153 in a similar group with the diagnosis of interest. We would therefore estimate that 53 of the total 153 were attributable to the diagnosis, meaning 35% (53/153) of all deaths are attributable to that diagnosis.
| Quantity of Interest | Estimate | 95% uncertainty interval |
|---|---|---|
| Number of people infected with HCV through blood transfusion between 1970 and 1991 | 26,800 | 21,300 to 38,800 |
| Number chronically infected (were they to survive 6 months post-transfusion) | 22,000 | 17,300 to 31,900 |
| Number chronically infected who survived to 10 years after transfusion | 8,120 | 6,330 to 11,900 |
| Number chronically infected, and survived to end 2019 (assuming extra HCV risk) | 2,700 | 2,050 to 3,910 |
| Number chronically infected, and died by end of 2019 | 19,300 | 15,100 to 28,200 |
| Number of deaths by end of 2019 related to HCV infection | 1,820 | 650 to 3,320 |
| Option | Description | Estimate | 95% uncertainty interval | Total scores/70 |
|---|---|---|---|---|
| A | Estimate in SEG Chapter 4 | 1,820 | 650 to 3,320 | 28 |
| B | Allowing for smaller effect of guidance in 1980s (60% of Option A’s central estimate) | 1,090 | 390 to 1,990 | 9 |
| C | Intermediate effect of guidance (80% of Option A’s central estimate) | 1,450 | 520 to 2,650 | 14 |
| D | Allowing for increased hazard ratio of 10-year survivor after HCV-infection in the 1970s => 17% uplift in centrally estimated HCV-attributable deaths | 2,130 | 760 to 3,900 | 19 |
| Combining estimates by selecting proportional to scores | 1,640 | 550 to 3,440 |
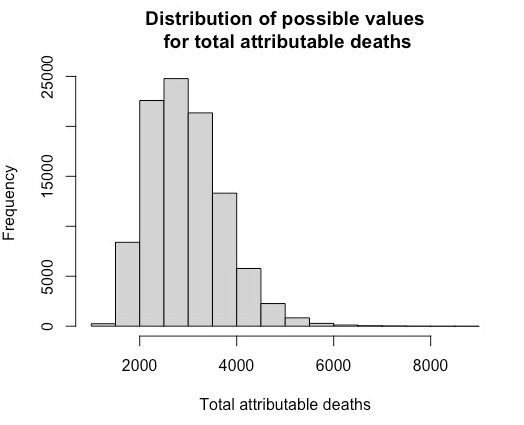
For four Options (A to D), Table 2.3 shows estimates and 95% uncertainty intervals, which essentially summarise underlying uncertainty distributions. We aim to produce an ‘average’ of these distributions, appropriately weighted by the relative support for these Options provided by SEG. This is not a simple exercise that can be carried out using an explicit formula, and requires a more sophisticated simulation (‘Monte Carlo’) method, akin to that used in the SEG Report for HCV-infections from blood transfusions.
Total attributable deaths for HCV-RNA infected transfusion recipients
To estimate the total number of attributable deaths of HCV infected transfusion recipients, we begin with the estimates shown in Table 2.3.
Option A, used in the SEG report, gives an estimate of 1,820 deaths, although with considerable uncertainty around this value. The method draws numbers at random from a distribution centred on 1820 but such that 95% of the simulated values are between 650 and 3,320, the 95% uncertainty level in the table above (the precise form of the distributions is described at the end of this box).1 Most values will be closer to 1,820, but more extreme values are also allowed to occur. 100,000 randomly sampled values are produced.
The same process is done for each of the other options, B, C and D: with randomly sampled values for each option, centred on 1,090, 1,450 and 2,130 respectively - this completes 100,000 ‘iterations’ of the simulation.
Then, for each of the 100,000 iterations, an option is chosen at random, with chances proportional to the scores in the final column of Table 2.3. For example, to produce a combined estimate from the first iteration, the number generated assuming option A is chosen with probability of 28/70, the number generated assuming option B would be chosen with a probability of 9/70 and so on for each of the options. This process is repeated for each iteration, producing 100,000 possible values for the deaths resulting from HCV infection.
The median (middle value) of all 100,000 is then chosen as the combined estimate, with the corresponding uncertainty interval chosen to include 95% of the 100,000 weighted values for deaths from that infection.
The resultant distribution of values and its median, reflects the ‘weight’ given to each option based on the scores assigned by the SEG, and Table 2.3 shows a combined estimate of 1,640 with an uncertainty interval from 550 to 3,440. Note that the combined estimate is not simply the weighted mean (or median) of the estimates for each option, since it is the median of a skew distribution formed by essentially probabalistic weighting of other skew distributions.
This whole process is then repeated for each of the other groups, producing the estimates in Table 2.7, Table 2.10, Table 2.12, Table 2.13 and Table 2.14.
1Distributional Forms Adopted For those intervals that are symmetric around the central estimate, we assume a normal distribution with appropriate mean and standard deviation. For asymmetric intervals, we assume a ‘split-log-normal’ distribution: on the log-scale, this assumes a half-normal distribution on each side of the median, with standard deviation chosen to match the 2.5% of 97.5% values derived from the 95% uncertainty interval.
| Sources | HIV diagnoses | Infected in the UK | Died by 2020 | Died by 2020 of HIV-related causes |
|---|---|---|---|---|
| Macfarlane Trust | 1,243 | 1,243 | 890 (72%)by 2013 | Unknown |
| UK Haemophilia Centre Doctors’ Organisation (UKHCDO) | 1,338 | Unknown but likely to be the great majority | 1,017 (76%) | 639 (48%) |
| UK Health Security Agency UKHSA) | ‘Haemophiliac’ 1,061‘Haemophiliac’ + ‘undetermined’ 1,243 | Unknown but likely to be the great majority | 820 (77%)963 (77%) | Unknown |
| HIV / AIDS | 589 |
| HIV related lymphoma | 50 |
| Hepatocellular carcinoma | 13 |
| Liver failure | 0 |
| Liver failure - HCV | 131 |
| Liver failure - other | 1 |
| Heart disease | 23 |
| Infection / multi-organ failure | 17 |
| Other causes | 193 |
| Total | 1,017 |
This adds to 589+50+13+0+131 = 784 HIV/HCV related deaths, comprising 784/1,017 = 77% of all deaths, and 784/1,338 = 58% of all those infected [Option A]. There were 40 deaths classified as heart disease or infection/multi-organ failure, making 824.
| ‘Haemophilia’ | ‘Other blood products’ | ‘Blood products (undetermined)’ | Total | |
|---|---|---|---|---|
| ‘AIDS related deaths’ | 258 | 73 | 45 | 376 |
| ‘Non-AIDS related deaths’ | 289 | 28 | 31 | 348 |
| Cause of death not reported | 273 | 47 | 67 | 387 |
| Total deaths | 820 | 148 | 143 | 1,111 |
| Total cases | 1,061 | 241 | 182 | 1,484 |
| Option | Description | Estimate | 95% uncertainty interval | Total scores /70 |
|---|---|---|---|---|
| A | Count of HIV/HCV categorised deaths from UKHCDO database - Allowing for only UK infections (~93%) | 729 | 23 | |
| [93% of 784] | ||||
| B | ‘AIDS-related deaths’ and ‘no cause of death reported’ in UKHSA database | 763 | 9 | |
| C | HIV/HCV, heart disease or infection/multi-organ failure from ‘well-defined dataset; | 817 | 14 | |
| D | Applying hazard-ratio analysis (+9%) to allow for uncategorised deaths | 898 | 881 to 914 | 24 |
| Combining estimates by selecting proportional to scores | 820 | 730 to 910 |
| Source | HCV infections (without HIV) | Deaths |
|---|---|---|
| UKHCDO report | Confirmed ~2,400Additional ‘possible’ at least 2,400 | ~700[39% from HCV-related causes]~1,400 |
| NHD | Well documented (i.e. both born & NHD-registered before 1992, & with record-linkage follow-up): 2,055 | Before 2020:536 |
| Skipton Fund | ~2,760 | ~900 |
| HCV +ve or presumed | Exposed but unknown HCV status | |
|---|---|---|
| Hepatocellular carcinoma (HCC) | 140 | 0 |
| Liver failure | 62 | 0 |
| Liver failure – HCV | 105 | 0 |
| Liver failure - other | 2 | 11 |
| Heart disease | 44 | 242 |
| Infection / multi-organ failure | 29 | 77 |
| Other causes | 249 | 1,056 |
| Total | 631 | 1,386 |
Table 2.10 Options and combined estimates for total attributable deaths from HCV infections in people with bleeding disorders.
| Option | Description | Estimate | 95% uncertainty interval | Total scores/70 |
|---|---|---|---|---|
| A | Count of HCV-categorised deaths, and other liver failure in those untested, from UKHCDO database | 320 | 16 | |
| B | HCV, heart disease or infection/multi-organ failure from ‘well-defined dataset’; plus pre-1992 ‘otherwise well-defined’ count of 12 (see Table 3.1 of Appendix) | 253 | 6 | |
| C | Hazard-ratio analysis for those HCV infected or presumed HCV infected; plus pre-1992 clinical consensus count of 43 after inflation by 1.17 (95% CI: 0.90 to 1.38) to 50 (95% CI: 39 to 59), (See Appendix section 3) | 290 | 240 to 340 | 11 |
| D | Hazard-ratio analysis for those HCV infected or presumed HCV infected (ie 290 above), plus mid-option for those with unknown HCV status, adding 140 (95%CI: 36 to 220) HCV-related deaths in 2000-2019, (See Appendix section 4) | 430 | 325 to 535 | 25 |
| E | Hazard-ratio analysis for those HCV infected or presumed HCV infected, plus upper-option for those with unknown HCV status, adding 222 HCV-related deaths in 1992-2019, (See Appendix section 4) | 510 | 360 to 665 | 12 |
| Combining estimates by selecting proportional to scores | 350 | 255 to 590 |
At least 79, and possibly up to ~100, people were infected with HIV through blood transfusions in the UK between 1970 and 1991, mostly pre-1986. Around 85% have subsequently died, but we do not know the causes of death.
A range of 20-40 deaths from HIV infection was discussed at the Inquiry.
| Acquired in UK | Acquired outside the UK | Country of infection not reported | Total | |
|---|---|---|---|---|
| ‘AIDS related deaths’ | 32 | 37 | 4 | 73 |
| ‘Non-AIDS related deaths’ | 10 | 17 | 1 | 28 |
| Cause of death not reported | 25 | 16 | 6 | 47 |
| Total deaths | 67 | 70 | 11 | 148 |
| Total cases | 79 | 137 | 25 | 241 |
| Option | Estimate | 95 %uncertaintyinterval | Total scores/70 | |
|---|---|---|---|---|
| A | UKHSA count of ‘AIDS-related deaths’ among those known to have been infected in the UK | 32 | 19 | |
| B | Allowing for additional HIV-related deaths | 36 | 32 to 40 | 51 |
| Combining estimates by selecting proportional to scores | 35 | 32 to 40 |
| Option | Estimate | 95% uncertainty interval | Total scores/70 | |
|---|---|---|---|---|
| A | Confirmed cases in SEG Report | 3 | 29 | |
| B | Allowance for additional cases in those who had received infected blood, and not been subject to appropriate testing at autopsy | 5 - 8 | 5 - 8 | 41 |
| Combining estimates by selecting proportional to scores | 5 | 3 to 8 |
| Option | RoundedEstimates (nearest 50) | 95% uncertaintyinterval |
|---|---|---|
| SEG (Option A) | 2,900 | 1,750 to 4,400 |
| Highest-scoring alternatives | 3,500 | 2,100 to 5,300 |
| Combining estimates by selecting proportional to scores | 2,900 | 1,750 to 4,650 |
Sarah Hayes is a post-doctoral research assistant in the Department of Statistics at the University of Oxford, funded by a National Institute for Health and Care Research grant as part of the Health Protection Research Unit (HPRU) in Emerging and Zoonotic Infections. Her research focuses on the epidemiology of emerging and zoonotic infections. Sarah holds a PhD in Infectious Disease Epidemiology and a Masters in Epidemiology, both from Imperial College London, and a Bachelor in Veterinary Medicine from the Royal Veterinary College.
Ruth McCabe is a doctoral student in the Department of Statistics at the University of Oxford funded by a National Institute for Health and Care Research studentship funded as part of the Health Protection Research Unit (HPRU) in Emerging and Zoonotic Infections. Her research focuses on the modelling and analysis of high-consequence infectious diseases, in particular COVID-19 which she has been working on since early 2020; the application of modelling techniques to inform policy; and methods by which to overcome the issues of missing or non-representative epidemiological data. Ruth has an undergraduate degree in Mathematics, Operational Research, Statistics and Economics from the University of Warwick and a Masters in Statistics from Imperial College London.
Stephen Evans is Emeritus Professor of Pharmacoepidemiology at the London School of Hygiene and Tropical Medicine. He works in the field of safety of medicines and is also interested in detecting scientific fraud and misconduct. He has been an independent expert for the European Medicines Agency Drug Safety Committee and was an advisor to the Bristol Royal Infirmary Inquiry.
Sheila Bird is Honorary Professor at the University of Edinburgh and former programme leader at the Medical Research Council (MRC) Biostatistics Unit, Cambridge. She led the MRC Biostatistical Initiative in support of AIDS/HIV studies in Scotland. She has championed the use of statistical methods in evaluating public policies. She has worked on UK dietary exposure to BSE, and on the design and interpretation of surveillance studies for abnormal prion protein; also on the late sequelae of Hepatitis C virus infection.
Penny Chan was scientific co-ordinator of the Krever Inquiry into the use of infected blood and blood products in Canada. She was subsequently the executive coordinator for the Canadian Advisory Council on Blood Safety and has spent 20 years as a consultant with the World Health Organisation.
Daniela De Angelis is Professor of Statistical Science for Health at the University of Cambridge and deputy director of the Medical Research Council Biostatistics Unit. Her research develops and applies statistical methods to characterise epidemics, exploiting the complex body of available information on different aspects of the disease of interest. Her work focuses on HIV, Hepatitis C and respiratory viruses.
Christl Donnelly is Professor of Applied Statistics at the University of Oxford and Professor of Statistical Epidemiology at Imperial College London. Her research brings together and develops statistical and biomathematical methods to analyse epidemiological patterns of infectious diseases, including vCJD, HIV and hepatitis A. She is also interested in promoting the public understanding of epidemiology and statistics.
Nicholas P. Jewell is Chair of Biostatistics and Epidemiology at The London School of Hygiene and Tropical Medicine. He was, until 2018, at the University of Berkeley. He has worked on statistical issues associated with studies of the natural history of infectious diseases including Human Immunodeficiency Virus (HIV) disease, dengue fever, Ebola Virus Disease, Severe Acute Respiratory Syndrome (SARS), and H1N1 influenza.
Graham Medley is Professor of Infectious Disease Modelling and former Director of the Centre for Mathematical Modelling of Infectious Disease at the London School of Hygiene and Tropical Medicine. His research uses mathematical models of transmission to inform public health interventions. He has advised the UK Government on HIV, vCJD and pandemic preparedness, and has chaired the SPI-M-O modelling sub-group of SAGE during the COVID-19 pandemic.
Sir David Spiegelhalter is Chair of the Winton Centre for Risk and Evidence Communication at the University of Cambridge, which aims to ensure that quantitative evidence and risk are presented to people in a fair and balanced way. He contributed to Public Inquiries into both children’s heart surgery at the Bristol Royal Infirmary, and the murders by Harold Shipman.
The standard verifying statement is as follows:
All contributing group members confirm that in respect of those parts of the report to which they have contributed:
Sections (i) and (ii) are somewhat unsuitable to statistical analyses, since we rely on data provided from a wide variety of sources, and so cannot say that the information we present is ‘within our knowledge’ or that we can confirm it to ‘be true’.
However, we can confirm that we have exercised our best professional judgement as to the quality and interpretation of the evidence that was available.
Estimates (with 95% uncertainty intervals) are provided for three sub-groups in turn. The subgroups are:
We focused primarily on 6,282 patients in the slimmed National Haemophilia Database (sNHD3) well-defined subset of patients with a bleeding disorder, as shown in Appendix Table 1.1.
Well-defined means: known sex and age-band at 1 January 1992; born before 1992; first NHD-registered before 1992; date of 1st treatment before 1992 or missing; alive at 1 January 1992; known to have been exposed to pooled plasma products pre-1988 or to components pre-1992.
In the well-defined subset, 966/6,282 persons with a bleeding disorder were HIV/HCV co-infected.
| HIV/HCV status | Exposure to HCV at-risk products via | Neither** | TOTALS | ||
|---|---|---|---|---|---|
| Pre-1988 pooled plasma ONLY | Pre-1992 components ONLY | BOTH pre-1988 pooled plasma & pre-1992 components | |||
| HIV-infected | 139 | 5 | 806 | 16 | 966 |
| HCV-positive | 631 | 146 | 1170 | 38 | 1985 |
| HCV-negative | 316 | 817 | 267 | 349 | 1749 |
| At-risk but HCV-status Not Known | 477 | 658 | 438 | 9 | 1582 |
| TOTAL | 1563 | 1626 | 2681 | 412 | 6282 |
** ‘Neither’ patients may, however, have been exposed to pooled plasma during 1988-1991
Accounting for persons with a bleeding disorder who were exposed to products that were at risk of transmitting HCV but whose HCV-status was not known to NHD requires the addition of further HCV-related deaths beyond those for persons who were HIV-infected (and assumed to be HIV/HCV co-infected) or who had been diagnosed HCV-positive. Moreover, pre-1992 blood-borne infection (BBI)-related deaths also need to be accounted for.
For each of the above subgroups, we provide a set of different central estimates (and associated 95% uncertainty interval) which reflect key judgements, and to which a sub-set of the authors may accord different credibility. We therefore elicited members’ degree of belief in the scenarios per subgroup by inviting each member to assign scores which totalled to 10: the higher the score, the greater the assigned credibility.
2.1 Basis for estimation: Estimation takes account of both HIV-related and HCV-related causes of death for HIV/HCV co-infected persons with a bleeding disorder. Estimation is based primarily on information from the National Haemophilia Database (NHD), the well-defined subset in particular, but cross-referenced to data made available by the UK Health Security Agency (UKHSA).
After covariate adjustment, the estimated HIV/HCV co-infection hazard-ratio (HR) for all-cause mortality during 2010-2019 allows us to derive the proportion [namely, (HR-1)/HR] of all deaths - experienced by HIV/HCV persons with a bleeding disorder in that decade - that was co-infection-related. We here rely on the same analysis framework as for mono-HCV-infected persons with a bleeding disorder (see below) although the estimated HR is higher for those co-infected. For example, the adjusted HR for HIV/HCV co-infected persons in 2010-2019 was 4.15 (95% CI: 2.86 to 6.02) versus 2.19 (95% CI: 1.72 to 2.79) for mono-HCV-diagnosed persons with a bleeding disorder (versus baseline: HCV-antibody negative persons with a bleeding disorder), Appendix A, Table A.1.
2.2 Unresolved problem: The date of HCV infection may have preceded the date of HIV infection for persons with a bleeding disorder who were HIV/HCV co-infected. Although HIV infections dated essentially from 1979 to 1986, HCV-infection dates may have been earlier than the earliest HIV-infection date of 1979.
2.3 How estimation proceeded: Switching missing HCV dates at 1 January 1992 or 1 January 2000 under-performed in terms of correctly retrieving epoch-specific hazard-ratios (HRs) during 1992-1999 and 2000-2009 for patients who were HIV/HCV co-infected for whom correctly-estimated HRs (versus those HIV-uninfected) were:
12.2 (95% CI: 10.1 to 14.8) in Epoch 1 (1992 to 1999);
4.4 (95% CI: 3.4 to 5.7) in Epoch 2 (2000 to 2009), reducing to
2.1 (95% CI: 1.5 to 2.8) in Epoch 3+4 (2010 to 2019).
Their Epoch 3+4 HR (versus those HCV-antibody-negative) was 4.15 (95% CI: 2.86 to 6.02) using the covariate-adjustment in Appendix A, Table A.1.
For HIV/HCV co-infected persons with a bleeding disorder, Appendix A, Table A.1 gives the adjusted HRs for Epoch 3+4 (vs those HCV-antibody-negative) when adjustment is restricted to sex, age-band and bleeding disorder/severity. This adjustment accords with the sort of adjustment made in UKHSA’s HCV-RNA-transfusion infected case versus control study.
In Appendix Table 2.1 for HIV/HCV co-infected persons with a bleeding disorder, we summarize three inter-dependent sources for assessing blood-borne infection-related (BBI-related) deaths. The three sources are:
| Epoch | Pre-1992 | 1992-1999 | 2000-2009 | 2010-2019 | 1992-2019 | TOTAL |
|---|---|---|---|---|---|---|
| i) PIVOT tables with 40% of deaths in 1990-94 estimated [E] to have occurred pre-1992 | ||||||
| HIV/AIDS; HIV lymphoma | E271 | E335 | 27 | 6 | E368 | 639 |
| HCC; any liver failure | E34 | E59 | 42 | 10 | E111 | 145 |
| ii) sNHD3 clinical consensus: pre-1992 if date of 1st treatment was pre-1992 or missing and, thereafter, by epoch for well-defined subset. Twelve HIV-infected persons with a bleeding disorder seemingly had 1st treatment date after 1992 (who may have been HIV-infected outside of the UK or by maternal transmission). | ||||||
| HIV/AIDS; HIV lymphoma | 261 | 342 | 26 | 4 | 372 | 633 |
| HCC; any liver failure | 23 | 70 | 42 | 10 | 122 | 145 |
| Infection/multi;heart disease | 10[3 + 7] | 5[0 + 5] | 9[6 + 3] | 15[7 + 8] | 29 | 39 |
| TOTAL | 294 | 417 | 77 | 29 | 523 | 817 |
| iii) sNHD3 well-defined subgroup: based on HR estimates applied to all-cause mortality during Epochs 1, 2 and 3+4 of 1992-2019 versus baseline of HCV-negative. | ||||||
| All-cause mortality for those HIV/HCV co-infected | 477 | 113 | 58 | 648 | ||
| Applicable HR (95% CI) for Epochs 1 & 2) or Appendix A.1 for Epoch 3+4 | 12.2 (10.1 to 14.8) |
4.4 (3.4 to 5.7) |
4.15 (2.9 to 6.0) |
|||
| Percentage of all deaths that are HIV/HCV-related is(HR-1)/HR (95% CI) | 91.8% (90.1% to 93.1%) |
77.3% (70.6% to 82.5%) |
75.9% (65.5% to 83.3%) |
|||
| Applying the above percentage to all-cause mortality, estimated number of HIV/HCV-related deaths (95% CI) | 438 (430 to 445) |
87 (80 to 93) |
44 (38 to 48) |
569 (558 to 580)Summed across Epochs: variance-sum = 32.1 |
||
For 1992-2019, the ratio of count iii) [569 (95% CI: 558 to 580), by HR estimation] to count ii) [523, by clinical consensus] is 1.09 (95% CI: 1.07 to 1.11). This ratio suggests that thepre-1992 count ii) [294, by clinical consensus] may warrant inflation by 9% to 320 (95%CI: 314 to 326).
Based on Appendix Table 2.1, we propose three options as follows for BBI-related deaths of HIV/HCV co-infected persons in the UK with a bleeding disorder:
Notice that differences between options are greater than the width of the confidence interval for the computational option iii) in Appendix Table 2.1.
3.1 Basis for estimation: Chronic HCV infection affects other organs besides the liver and so, lacking an HCV-RNA case-control study such as UKHSA’s look-back study afforded for those HCV-infected via transfusion, estimation for mono-HCV-infected persons with a bleeding disorder has to rely upon proportional hazards regression analysis to account for other potentially influential covariates that could define the counterfactual for persons with a bleeding disorder (namely sex and age-band at 1 January 1992 together with bleeding disorder and its severity).
Having adjusted for these potentially influential covariates, the estimated HRs pertaining to HCV-status in a particular epoch, such as 2010-2019, then allows us to ascribe the proportion of all deaths in the epoch that are HCV-related as (HR-1)/HR.
3.2 Problems to be resolved in achieving estimation: First, the National Haemophilia Database (NHD) does not provide information on chronic HCV infection (HCV-RNA positive) as distinct from HCV antibody positivity. Hence, HCV-diagnosed and HCV-positive (without further specification) are here used interchangeably.
Second, HCV antibody testing to protect the UK’s blood supply was introduced on 1 September 1991. Thereafter, based on presumed early outreach to potentially HCV-exposed persons with a bleeding disorder to offer counselling and HCV antibody testing, we might expect their known HCV test dates to cluster around 1991 and 1992. But they do not.
Third, the above presumption is not supported evidentially for two reasons: first, because HCV test dates are substantially missing from NHD (only one-sixth of HCV testees reported to NHD have recorded test dates); secondly, because 19% of HCV test dates that are recorded occurred in the 21st century. Hence, we cannot assume that HCV-status, as recorded on NHD, was already established by 1 January 1992 for persons with a bleeding disorder who were alive at 1 January 1992 and first treated before 1992 (ie potentially HCV-exposed).
The initial offer of HCV testing may have been declined, reporting of initial HCV test results to NHD may have been resisted, or inadequately recorded, or an HCV test offer was not made for a range of reasons: patient’s age (young child), concern about properly informed consent, confidentiality, stigma, or clinical uncertainty about the longer-term implications of HCV infection and its treatment.
Fourth, and due to the above complication, in proportional hazards regression analyses we have to treat HCV-diagnosed and HCV-negative as time-dependent indicators which switch from zero to 1 at the patient’s recorded HCV test date; alternatively, if the HCV test date is missing, the switch occurs at 1 January 2010. [NB: Switching all missing at 1 January 1992 or at 1 January 2000 gave still-biased answers for those HIV/HCV co-infected, who were our barometer.]
Fifth, for those chronically HCV-infected by transfusion, HR for all-cause mortality related to the calendar period 2000-2019 and was estimated from UKHSA’s look-back study for traced persons who had received an HCV-implicated transfusion: HCV-RNA positive cases versus controls. Due to missing HCV test dates, the corresponding HR for all-cause mortality, as estimated by us for persons with a bleeding disorder who were HCV-diagnosed but HIV uninfected, relates to the calendar period 2010-2019. Hence, a judgement call is made in its application to 1992-2009 also, a judgement that appears reasonable in the light of the UKHSA analysis as precedent.
Sixth, as a further complication, HCV-status was not known at NHD for nearly 1,600 persons with a bleeding disorder who were considered to have been at-risk of HCV-infection due to exposure to pooled plasma pre-1988 or to components pre-1992. Not-known at NHD is not the same as not-known by the patient or haemophilia centre. Both calculation and judgement are required in assessing how many of these nearly 1,600 persons with a bleeding disorder whose HCV-status was not-known at NHD are indeed HCV-infected, see Appendix B and Section 4.
Judgement calls are supported by calibration of the HR-estimated proportion of all deaths as HCV-related against the UK Haemophilia Centre Doctors’ Organisation (UKHCDO) consensus coding for cause of death.
Seventh, some HCV-related deaths may have occurred pre-1992 for persons with a bleeding disorder who were HCV-infected (but not HIV-infected), on which UKHCDO’s consensus coding for causes of death pre-1992 sheds some light. The calibration referred to above is used to inflate (as necessary) the pre-1992 clinical consensus counts to account for HCV-related causes of death other than Hepatocellular Carcinoma (HCC) or any liver failure.
3.3 How estimation proceeded: For those persons with a bleeding disorder in the well-defined subset, the covariate-adjusted HRs for all-cause mortality during 2010-2019 according to HIV/HCV status are given in Appendix A, Table A.1.
Recall that even when NHD was aware that a patient had been either HCV-diagnosed or had tested HCV-antibody-negative, it holds an HCV test date for only one-sixth of those known by NHD to have been HCV-tested.
Recorded HCV test dates do not cluster around 1991 and 1992. Indeed, 19% of the 602 recorded HCV test dates occurred later than 1999.
Hence, two time-dependent indicators had to be defined which indicated respectively: when HCV-infection was diagnosed; when HCV antibody negative status was established. The respective indicators were switched-on (i.e. switched from zero to 1) at the patient’s known HCV test date or - if HCV test date was missing - at 1 January 2010.
Sensitivity analyses – which entailed switching missing dates at 1 January 1992 or 1 January 2000 – under-performed in terms of correctly retrieving epoch-specific hazard-ratios (HRs) during 1992-1999 and 2000-2009 for patients who were HIV/HCV co-infected for whom correctly-estimated HRs (versus those HIV-uninfected) are as shown in Section 2.
In practical terms, missing HCV test dates meant that we could not rely upon HR-estimation for HCV-diagnosed persons in Epoch 1 (1992-1999) and Epoch 2 (2000-2009).
See Appendix A, Table A.1 for adjusted HRs for Epoch 3+4 (vs those HCV antibody negative) when adjustment is restricted to sex, age-band and bleeding disorder/severity. This adjustment accords with the sort of adjustment made in UKHSA’s HCV-RNA-transfusion infected case versus control study – except that NHD records only those HCV-diagnosed without further specification to identify those chronically HCV-infected.
In Epoch 3+4 (2010-2019), HR for HCV-diagnosed (versus HCV-antibody negative, see Appendix A, Table A.1) is 2.19 (95% CI: 1.72 to 2.79); and for HCV-status not known is 1.40 (1.08 to 1.81).
In Appendix Table 3.1 for mono-HCV-infected persons with a bleeding disorder, we summarize inter-dependent sources for assessing blood-borne infection-related (BBI-related) deaths. The three sources are:
| Epoch | Pre-1992 | 1992-1999 | 2000-2009 | 2010-2019 | 1992-2019 | TOTAL |
|---|---|---|---|---|---|---|
| iv) PIVOT tables with 40% of deaths in 1990-94 estimated [E] to have occurred pre-1992 (first two rows include presumed HCV +ve in addition to HCV-diagnosed) | ||||||
| HCC | E6 | E21 | 43 | 63 | E127 | 133 |
| Any liver failure bar HCC | E37 | E37 | 42 | 51 | E130 | 167 |
| Any liver failure bar HCC in HCV at-risk but NK-status | E5 | E2 | 4 | 0 | E6 | 11 |
| Any liver failure bar HCC in “HCV not at-risk, presumed” | 1 | 1 | 8 | 30 | 39 | 40 |
| v) sNHD3 clinical consensus: pre-1992 if date of 1st treatment was pre-1992 or missing and, thereafter, by epoch for well-defined subset: HCV-diagnosed | ||||||
| HCC; liver failure-HCV | 2 + 7 = 9 | 13+26 = 39 | 33+33 = 66 | 40+35 = 75 | 180 | 189 |
| Any other liver failure | 2 | 0 | 1 | 0 | 1 | 3 |
| Infection/multi;heart disease | 0 + 1 = 1 | 2 + 4 = 6 | 3 + 7 = 10 | 20+24 = 44 | 60 | 61 |
| TOTAL | 12 | 45 | 77 | 119 | 241 | 253 |
| vi) sNHD3 well-defined subgroup: based on HR-estimates applied to all-cause mortality during Epoch 3+4 (2010-2019) also to all-cause mortality in Epoch 2 (2000-2009) versus baseline of HCV-negative. | ||||||
| All-cause mortality for those diagnosed as mono-HCV-infected | 66 + 2 (switches)= 68 | 117 + 3 (switches)= 120 | 255 | 443 | ||
| Applicable HR (95% CI) from Appendix A.1 for Epoch 3+4: applied also to Epochs 1 & 2 | 2.19 (1.72 to 2.79) |
|||||
| Percentage of all deaths that are HCV-related is (HR-1)/HR (95% CI) | 54.3% (41.9% to 64.2%) |
|||||
| Applying the above percentage to all-cause mortality, estimated number of mono-HCV-related deaths (95% CI) | 37 (28 to 44) |
65 (50 to 77) |
139 (107 to 164) |
241 (208 to 274)Application of sum of variances = 275.5 |
241 (185 to 284)Application of HR 2.19 (95% CI) to 443 deaths |
|
For 1992-2019, the ratio of count vi) [241 (95% CI: 185 to 284), by HR estimation] to count v) [241, by clinical consensus] is 1.0 (95% CI: 0.77 to 1.18).
For Epoch 3+4 alone, wherein HR was formally estimated, the ratio of count vi) [139 (95% CI: 107 to 164), by HR estimation] to count v) [119, by clinical consensus] is 1.17 (95% CI: 0.90 to 1.38).
This 2010-2019 ratio might suggest that the pre-1992 count iv) 43 by clinical consensus] may warrant inflation by 17% to 50 (95% CI: 39 to 59).
In summary, for persons with a bleeding disorder who were diagnosed as mono HCV-infected or were presumed HCV-infected, we posit a count of 241 + 50 = 291 (95% CI: 241 to 342) BBI-related deaths [Option C in Summary account in the main text].
Having set out in Appendix Table 3.1 the available options for persons with a bleeding disorder who were HCV-diagnosed but were not HIV-infected, we then consider the contribution to BBI-related deaths that should be added to account for the HCV-infected subset within HCV at-risk persons with a bleeding disorder whose HCV-status is not known to NHD. The options are:
Accounting for persons with a bleeding disorder who were exposed to HCV at-risk products but whose HCV-status was not known to NHD may require the addition of further BBI-related deaths [Options D and E above].
Clinical consensus (see Appendix A, Table A.2) recorded their deaths from HCC, any liver disease or infection/multi system disease as 30, 40 and 25 in Epochs 1, 2 and 3+4 (95 deaths) plus a further 67, 61 and 25 deaths from heart disease (additional 153 deaths). We propose:
Take-home message from Sections 3 & 4: Mono-HCV-infected persons with a bleeding disorder (diagnosed and HCV-status not known) contribute an upper estimate of 510 (95% CI: 360 to 665) BBI-related deaths to end 2019 [Option E in Table. 2.10 of this report], a mid-approximation of 430 (95% CI: 325 to 535), BBI-related deaths to end 2019 [Option D in Table. 2.10 of this report], and a lower extreme of 291 (95% CI: 241 to 342), BBI-related deaths to end 2019 [Option C in Table. 2.10 of this report].
For 1992-2019, the ratio of count vi) [241 (95% CI: 185 to 284), by HR estimation] to count v) [241, by clinical consensus] is 1.0 (95% CI: 0.77 to 1.18). For Epoch 3+4 alone, wherein HR was estimated, the ratio of count vi) [139 (95% CI: 107 to 164), by HR estimation] to count v) [119, by clinical consensus] is 1.17 (95% CI: 0.90 to 1.38).
This ratio might suggest that the pre-1992 count [v) 12 or iv) 43 by clinical consensus] may warrant inflation by 17% to 14 (11 to 19) or 50 (95% CI: 39 to 59).
| COVARIATES | EPOCHS 3+4: 580 death(2010-2019, 10 years); HIV-status | EPOCHS 3+4: 580 death(2010-2019, 10 years); HCV-status | ||
|---|---|---|---|---|
| Hazard Ratio, HR | 95% CI for HR | Hazard Ratio, HR | 95% CI for HR | |
| Gender (baseline: male) | ||||
| Female | 0.69 | 0.49 to 0.95 | 0.67 | 0.48 to 0.93 |
| Age-band at 31 December 1991 (baseline: 20-29 years) | ||||
| Under 20 | 0.51 | 0.33 to 0.79 | 0.54 | 0.35 to 0.83 |
| 30-39 | 1.74 | 1.28 to 2.36 | 1.74 | 1.28 to 2.36 |
| 40-49 | 3.57 | 2.66 to 4.79 | 3.69 | 2.75 to 4.96 |
| 50-59 | 8.3 | 6.2 to 11.2 | 9.1 | 6.8 to 12.3 |
| 60+ years | 18.4 | 13.6 to 24.9 | 20.7 | 15.1 to 28.4 |
| Bleeding Disorder Diagnosis & Severity (baseline: Haemophilia A <= 5 IU/dl) | ||||
| Haemophilia A other | 1.06 | 0.85 to 1.33 | 1.18 | 0.93 to 1.48 |
| Haemophilia B <= 5 IU/dl | 1.22 | 0.88 to 1.70 | 1.17 | 0.84 to 1.63 |
| Haemophilia B other | 1.13 | 0.75 to 1.72 | 1.21 | 0.79 to 1.83 |
| Von Willebrand disease | 1.17 | 0.84 to 1.63 | 1.44 | 1.03 to 2.02 |
| Any Acquired BD/Other | 1.17 | 0.76 to 1.79 | 1.33 | 0.86 to 2.06 |
| HIV-status (baseline = not known to be HIV-infected includes mono HCV-infected persons) | ||||
| HIV-antibody-positive | 2.32 | 1.70 to 3.17 | ||
| HCV-status (baseline = HCV-negative at NHD) | ||||
| HIV-antibody-positive | 4.15 | 2.86 to 6.02 | ||
| HCV-positive | 2.19 | 1.72 to 2.79 | ||
| HCV-status NK | 1.40 | 1.08 to 1.81 | ||
NB: Unknown HIV/HCV status patients experienced: 97 heart disease, HCC, any liver failure, or infection/multisystem disease deaths [30 if heart disease is discounted].
| Clinical Consensus on Underlying Cause of Death | Unknown | Known HCV NEG | Known HCVPOSITIVE | HIV | Total |
|---|---|---|---|---|---|
| 1. Accidental death | 1 | 0 | 0 | 0 | 1 |
| 2. Acquired bleeding | 10 | 0 | 0 | 1 | 11 |
| 3. Bleeding - abdomen | 0 | 0 | 0 | 3 | 3 |
| 4. Bleeding - chest | 1 | 0 | 0 | 0 | 1 |
| 5. Bleeding – gastro | 8 | 0 | 2 | 0 | 10 |
| 6. Bleeding – intracranial | 48 | 0 | 7 | 30 | 85 |
| 7. Bleeding – other | 3 | 0 | 0 | 0 | 3 |
| 9. Cancer – other | 49 | 0 | 8 | 9 | 66 |
| 10. Creutzfeldt-Jakob | |||||
| 11. Frailty/ dementia | 8 | 0 | 2 | 0 | 10 |
| 12. HIV / AIDS | 0 | 0 | 0 | 320 | 320 |
| 13. HIV lymphoma | 0 | 0 | 0 | 22 | 22 |
| 14. Heart disease | 67 | 3 | 4 | 5 | 79 |
| 15. Hepatocellular cancer | 7 | 0 | 12 | 3 | 22 |
| 16. Infection / multi | 11 | 0 | 2 | 0 | 13 |
| 17. Liver failure | 10 | 0 | 0 | 0 | 10 |
| 18. Liver failure – HCV | 1 | 0 | 25 | 67 | 93 |
| 19. Liver failure – other | 1 | 0 | 0 | 0 | 1 |
| 20. Not known | 3 | 0 | 0 | 6 | 9 |
| 21. Other medical disease | 25 | 1 | 1 | 4 | 31 |
| 22. Overdose | 3 | 1 | 0 | 1 | 5 |
| 23. Post-op complication | 1 | 0 | 2 | 0 | 3 |
| 24. Ruptured aneurysm | 6 | 0 | 0 | 1 | 7 |
| 25. Stroke: thrombotic | 4 | 0 | 1 | 0 | 5 |
| 26. Suicide | 8 | 0 | 0 | 0 | 8 |
| 27. Trauma | 5 | 1 | 0 | 5 | 11 |
| 28. Venous thrombosis | 1 | 0 | 0 | 0 | 1 |
| TOTALS | 281 | 6 | 66 | 477 | 830 |
| SUB-TOTALS re BLEEDING(as %) | 60(21.4) | 0(0.0) | 9(13.6) | 33(6.9) | 102(12.3) |
NB: Unknown HIV/HCV status patients experienced: 101 heart disease, HCC, any liver failure, or infection/multisystem disease deaths [40 if heart disease is discounted].
| Clinical Consensus on Underlying Cause of Death | Unknown | Known HCV NEG | Known HCVPOSITIVE | HIV | Total |
|---|---|---|---|---|---|
| 1. Accidental death | 4 | 0 | 0 | 1 | 5 |
| 2. Acquired bleeding | 5 | 1 | 0 | 0 | 6 |
| 3. Bleeding - abdomen | 1 | 0 | 0 | 1 | 2 |
| 4. Bleeding - chest | 0 | 0 | 1 | 0 | 1 |
| 5. Bleeding – gastro | 5 | 0 | 4 | 2 | 11 |
| 6. Bleeding – intracranial | 54 | 3 | 9 | 15 | 81 |
| 7. Bleeding – other | 4 | 1 | 0 | 2 | 7 |
| 9. Cancer – other | 58 | 5 | 9 | 8 | 80 |
| 10. Creutzfeldt-Jakob | |||||
| 11. Frailty/ dementia | 14 | 1 | 1 | 0 | 16 |
| 12. HIV / AIDS | 0 | 0 | 0 | 20 | 20 |
| 13. HIV lymphoma | 0 | 0 | 0 | 6 | 6 |
| 14. Heart disease | 61 | 1 | 7 | 3 | 72 |
| 15. Hepatocellular cancer | 7 | 0 | 33 | 7 | 47 |
| 16. Infection / multi | 27 | 2 | 3 | 6 | 38 |
| 17. Liver failure | 3 | 0 | 0 | 0 | 3 |
| 18. Liver failure – HCV | 0 | 0 | 31 | 35 | 66 |
| 19. Liver failure – other | 3 | 0 | 1 | 0 | 4 |
| 20. Not known | 11 | 0 | 3 | 2 | 16 |
| 21. Other medical disease | 36 | 2 | 9 | 2 | 49 |
| 22. Overdose | 5 | 0 | 0 | 1 | 6 |
| 23. Post-op complication | 4 | 1 | 0 | 0 | 5 |
| 24. Ruptured aneurysm | 3 | 0 | 1 | 0 | 4 |
| 25. Stroke: thrombotic | 11 | 1 | 4 | 0 | 16 |
| 26. Suicide | 8 | 0 | 0 | 2 | 10 |
| 27. Trauma | 8 | 1 | 1 | 0 | 10 |
| 28. Venous thrombosis | 2 | 0 | 0 | 0 | 2 |
| TOTALS | 334 | 19 | 117 | 113 | 583 |
| SUB-TOTALS re BLEEDING(as %) | 64(19.2) | 4(21.1) | 14(12.0) | 20(17.7) | 102(17.5) |
NB: Unknown HIV/HCV status patients experienced: 50 heart disease, HCC, any liver failure, or infection/multisystem disease deaths [25 if heart disease is discounted].
| Clinical Consensus on Underlying Cause of Death | Unknown | Known HCV NEG | Known HCVPOSITIVE | HIV | Total |
|---|---|---|---|---|---|
| 1. Accidental death | 1 | 0 | 5 | 0 | 6 |
| 2. Acquired bleeding | 4 | 0 | 0 | 0 | 4 |
| 3. Bleeding - abdomen | 0 | 1 | 1 | 1 | 3 |
| 4. Bleeding - chest | 0 | 0 | 1 | 1 | 2 |
| 5. Bleeding – gastro | 4 | 2 | 3 | 0 | 9 |
| 6. Bleeding – intracranial | 9 | 4 | 26 | 9 | 48 |
| 7. Bleeding – other | 0 | 0 | 1 | 2 | 3 |
| 9. Cancer – other | 37 | 33 | 53 | 9 | 132 |
| 10. Creutzfeldt-Jakob | 1 | 0 | 1 | 0 | 2 |
| 11. Frailty/ dementia | 12 | 8 | 7 | 0 | 27 |
| 12. HIV / AIDS | 0 | 0 | 0 | 2 | 2 |
| 13. HIV lymphoma | 0 | 0 | 0 | 2 | 2 |
| 14. Heart disease | 25 | 12 | 24 | 8 | 69 |
| 15. Hepatocellular cancer | 8 | 0 | 39 | 2 | 49 |
| 16. Infection / multi | 17 | 17 | 20 | 7 | 61 |
| 17. Liver failure | |||||
| 18. Liver failure – HCV | 0 | 0 | 33 | 8 | 41 |
| 19. Liver failure – other | 0 | 2 | 0 | 0 | 2 |
| 20. Not known | 3 | 3 | 11 | 1 | 18 |
| 21. Other medical disease | 26 | 20 | 25 | 3 | 74 |
| 22. Overdose | 1 | 1 | 0 | 1 | 3 |
| 23. Post-op complication | 1 | 0 | 0 | 1 | 2 |
| 24. Ruptured aneurysm | 1 | 1 | 0 | 0 | 2 |
| 25. Stroke: thrombotic | 4 | 3 | 3 | 0 | 10 |
| 26. Suicide | 1 | 1 | 1 | 1 | 4 |
| 27. Trauma | 0 | 3 | 1 | 0 | 4 |
| 28. Venous thrombosis | 1 | 0 | 0 | 0 | 1 |
| TOTALS | 156 | 111 | 255 | 58 | 580 |
| SUB-TOTALS re BLEEDING(as %) | 13(8.3) | 7(6.3) | 32(12.5) | 13(22.4) | 65(11.2) |
HCV-status switches during Epoch & deaths during Epoch for those switched are recorded in the extra final rows of the table.
| COVARIATES | EPOCH 1: 830 deaths6,282 persons at-risk | EPOCH 2: 583 deaths5,452 persons at-risk | EPOCH 3+4: 580 deaths4,869 persons at-risk | |||
|---|---|---|---|---|---|---|
| # initial risk-set | # deaths | # initial risk-set | # deaths | # initial risk-set | # deaths | |
| Male | 5230 | 783 | 4447 | 498 | 3949 | 484 |
| Female | 1052 | 47 | 1005 | 85 | 920 | 96 |
| Age-band @ 31 December 1991 | ||||||
| Under 20 | 1462 | 79 | 1383 | 34 | 1349 | 32 |
| 20-29 | 1389 | 139 | 1250 | 63 | 1187 | 73 |
| 30-39 | 1251 | 150 | 1101 | 88 | 1013 | 97 |
| 40-49 | 981 | 127 | 854 | 100 | 754 | 130 |
| 50-59 | 559 | 102 | 457 | 101 | 356 | 125 |
| 60+ | 640 | 233 | 407 | 197 | 210 | 123 |
| Bleeding disorder: diagnosis & severity @ 1992 | ||||||
| HaemA <=5 | 2246 | 534 | 1712 | 206 | 1506 | 171 |
| HaemA other | 1558 | 140 | 1418 | 154 | 1264 | 182 |
| HaemB <= 5 | 494 | 32 | 462 | 53 | 409 | 48 |
| HaemB other | 292 | 26 | 266 | 26 | 240 | 28 |
| VonWillebrand | 1175 | 63 | 1112 | 97 | 1015 | 106 |
| Any Acq/other | 517 | 35 | 482 | 47 | 435 | 45 |
| Exposure to components pre-1992 | ||||||
| YES | 4370 | 706 | 3601 | 472 | 3129 | 454 |
| No | 1975 | 124 | 1851 | 111 | 1740 | 126 |
| Exposure to pooled plasma | ||||||
| Yes, pre-1988 | 4244 | 730 | 3514 | 440 | 3074 | 441 |
| Yes, 1988-91 | 635 | 29 | 606 | 38 | 568 | 41 |
| No | 1403 | 71 | 1332 | 105 | 1227 | 98 |
| HCV-status @ beginning of EPOCH | ||||||
| HIV-infected | 966 | 477 | 489 | 113 | 376 | 58 |
| HCV positive | 1739 | 66 | 1870 | 117 | 1796 | 255 |
| HCV negative | 1580 | 6 | 1688 | 19 | 1716 | 111 |
| HCV-status NK @ NHD | 1997 | 281 | 1405 | 334 | 981 | 156 |
| HCV-status switches during epoch and associated deaths | ||||||
| Switched to HCV positive | 199 | 2 | 50 | 3 | 4 | 0 |
| Switched to HCV negative | 114 | 1 | 47 | 4 | 0 | 0 |
| Switched out from HCV-NK | 313 | 3 | 97 | 7 | 4 | 0 |
We focused primarily on 6,282 patients in the slimmed National Haemophilia Database (sNHD3) well-defined subset of patients with a bleeding disorder, as shown in Table B1.
Well-defined means: known sex and age-band at 1 January 1992; born before 1992; 1st NHD-registered before 1992; date of 1st treatment before 1992 or missing; alive at 1 January 1992; known to have been exposed to pooled plasma products pre-1988 or to components pre-1992.***
In the well-defined subset, 966/6,282 persons with a bleeding disorder were HIV/HCV co-infected.
| HIV/HCV status | Exposure to HCV at-risk products via | TOTALS | |||
|---|---|---|---|---|---|
| Pre-1988 pooled plasma ONLY | Pre-1992 components ONLY | BOTH pre-1988 pooled plasma & pre-1992 components | Neither** | ||
| HIV-infected | 139 | 5 | 806 | 16 | 966 |
| HCV-positive | 631 | 146 | 1170 | 38 | 1985 |
| HCV-negative | 316 | 817 | 267 | 349 | 1749 |
| At-risk but HCV-status Not Known | 477 | 658 | 438 | 9 | 1582 |
| TOTALS | 1563 | 1626 | 2681 | 412 | 6282 |
** ‘Neither’ patients may, however, have been exposed to pooled plasma during 1988-199
We assume that all who were HIV-infected were also HCV-infected and that their HIV-status took testing precedence. Hence, our interest focuses primarily on the association between exposure to HCV at-risk products (for those exposed) and whether the patient was HCV-tested.
Notice that, when HCV-tested, only a small percentage of the 387 HIV-uninfected HCV-tested persons with a bleeding disorder but with no known exposure were HCV-positive [38/387 or 9.8% (95%CI: 6.8% to 12.8%)] and so, for the nine, apparently unexposed, who were not HCV-tested, we might expect 0.9 HCV-positives (95% CI: 0.6 to 1.2).
For those exposed but not HIV-infected, having been recorded by NHD as HCV-tested is not independent of exposure type, see Table B.2. Patients with both exposure types were significantly more likely to be HCV-tested (1437 HCV-tested versus 1276 expected). The HCV-testing deficit was most marked for those exposed ONLY to pre-1992 components (963 HCV-tested versus 1103 expected).
| HCV-tested as known to National Haemophilia Database | Exposure to HCV at-risk products via: | TOTALS | ||
|---|---|---|---|---|
| Pre-1988 pooled plasma ONLY | Pre-1992 components ONLY | BOTH pre-1988 pooled plasma & pre-1992 components | ||
| HCV-tested | 947 (expected: 969) |
963 (expected: 1103) |
1437 (expected: 1276) |
3347 |
| NK HCV-tested | 477 (expected: 455) |
658 (expected: 482) |
438 (expected: 599) |
1573 |
| TOTALS% HCV-tested (95% confidence interval) |
1424 66.5% (64.1% to 69.0%) |
1621 59.4% (57.0% to 61.8%) |
1875 76.6% (74.7% to 78.6%) |
4920 |
The above differential HCV-tested rates according to HCV at-risk exposure-route [66.5% (95% CI: 64% to 69%) if exposed ONLY to pre-1988 pooled plasma; 59.4% (95% CI: 57% to 62%) if exposed ONLY to pre-1992 components; but 76.6% (95% CI: 75% to 79%) HCV-tested if exposed to BOTH] are only the first part of the story.
The second part is that, when HCV-tested, the HCV-positive rate is also different according to the HCV at-risk exposure-route, being 66.6% (95% CI: 64% to 70%) if exposed ONLY to pre-1988 pooled plasma; 15.2% (95% CI: 13% to 17%) if exposed ONLY to pre-1992 components; but 81.4% (95% CI: 79% to 83%) HCV-infected if exposed to BOTH, see Table B.3.
When HCV-tested, all three HCV-positive rates seem to have been sufficiently high to have warranted comprehensive counselling and the offer of HCV antibody testing to those at-risk by any one of the three HCV at-risk exposure-routes.
| When tested, HCV-test result | Exposure to HCV at-risk products via | TOTALS | ||
|---|---|---|---|---|
| Pre-1988 pooled plasma ONLY | Pre-1992 components ONLY | BOTH pre-1988 pooled plasma & pre-1992 components | ||
| HCV-positive | 631 | 146 | 1170 | 1947 |
| HCV-negative | 316 | 817 | 267 | 1400 |
| TOTALS% HCV-positive(95% confidence interval) | 947 66.6% (63.6 to 69.6%) |
963 15.2% (12.9 to 17.4%) |
1437 81.4% (79.4 to 83.4%) |
3347 |
Not known to have been HCV-tested according to the National Haemophilia Database (NHD) is not the same as patients having never been HCV-tested. Moreover, the NHD may be more likely to be informed about HCV at-risk persons with a bleeding disorder who had tested HCV-positive than if the patient had tested HCV-antibody-negative.
We might therefore argue – at one extreme - that almost all HCV at-risk persons with a bleeding disorder will have been HCV-tested; and almost all of those for whom NHD lacks information on HCV test status will have tested HCV-antibody-negative.
Alternatively – at the opposite extreme - we might assume that the exposure-specific HCV-positive rates when HCV-tested, which we document in Table B.3, apply equally to those in the same exposure-group who, according to NHD, have not been HCV-tested.
Table B.4 therefore applies the above exposure-specific HCV-positive rates when HCV-tested to the persons with a bleeding disorder who shared the same exposure-route but were not HCV-tested according to the NHD.
| Well-defined subset: number not known at NHD as HCV-tested, see Table 3.1 | Exposure to HCV at-risk products via | TOTALS | |||
|---|---|---|---|---|---|
| Pre-1988 pooled plasma ONLY | Pre-1988 pooled plasma ONLY | Pre-1988 pooled plasma ONLY | EXPOSED to NEITHER** | ||
| 477 | 658 | 438 | 9 | 1582 | |
| Upper extreme: expected number HCV-positive (95% CI) | 66.6% of 477 = 318 (303 to 332) |
15.2% of 658= 100 (85 to 114) |
81.4% of 438 = 357 (348 to 365) |
9.8% of 9= 0.9 (0.6 to 1.2) |
776 Sum of variances = 134.4 (753 to 799) |
** NEITHER patients may, however, have been exposed to pooled plasma during 1988-1991.
The resultant upper extreme is that 776/1582 (49%, 95% CI: 47.6% to 50.5%) of well-defined persons with a bleeding disorder who are not known to have been HCV-tested may, in fact, be HCV-antibody-positive (95% CI: 753 to 799), see Table B.4.
If this upper extreme estimate of 776 (49%) is closer to the mark than zero being HCV-infected among those in the well-defined cohort for whom the NHD has recorded their HCV-test-status as Not Known, then the HR in Table A.1 for those whose HCV test status is Not Known should reflect that, after adjustment for demography and bleeding disorder/severity (for which exposure-route is a proxy), they are an almost equal mixture [49%; 51%] of those HCV-positive and those HCV-antibody-negative.
If the lower extreme applies, their associated HR would be as for those who had tested HCV antibody negative.
The estimated HR in Table A.1 rules out the lower and suggests that the upper extreme of 49% is an over-estimation of the percentage who were truly HCV-infected, which is closer to 34% (or 540 persons) according to Table A.1.
(1) Transcript 9 November pp174-178 INQY1000258
(2) Transcript 9 November pp182-195 INQY1000258